System Overview Dashboard
The System Overview Dashboard of the application allows you to view a snapshot of your monitoring program.
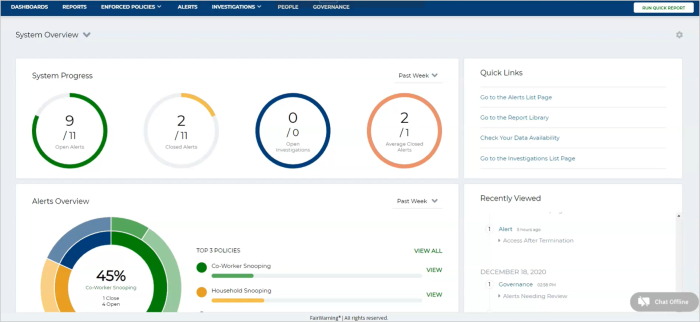
The following widgets are available on the System Overview Dashboard:
System Progress
The System Progress widget allows you to see the number of:
-
Open Alerts—automated Alerts with a status of Not Reviewed.
-
Completed Alerts—automated Alerts with a status of Reviewed – Closed that are dismissed by users or automatically by Imprivata Access Intelligence Intelligent Filtering or Machine Learning.
-
Open Investigations—Investigations with a default status of Open and Active.
-
Average Closed Alerts —average number of closed Alerts for the selected period of time.
You can update widgets to display data points for the past day, week, month, or quarter.
Widgets only show the data that is available for your user role.
Quick Links
You can use the Quick Links widget to easily navigate to Alerts that require review through the Alerts page, Analytic Reports in the robust Report Library, check Data Availability, or go to the Investigations page to access Investigations owned by you.
The following quick links are available:
-
Go to Alerts List Page—navigates directly to the Enforced Policies with open Alerts.
-
Go to the Report Library—navigates to the Report Library where you can view numerous prebuilt Reports applicable to your integrated data sources.
-
Check Your Data Availability—opens the Data Integrity dialog box where you can check the availability of audit, authoritative, and analytic data. Data Integrity ensures that data that is sent to Imprivata Access Intelligence is available for reporting. The Data Integrity widget can show you if the audit log files are delivered and loaded into Imprivata Access Intelligence.
-
Go to the Investigations List Page—navigates to the Investigations page.
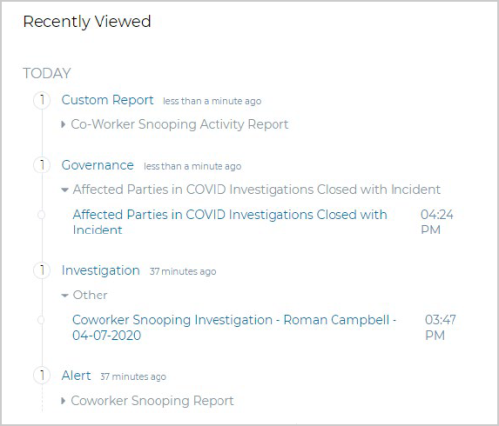
Recently Viewed
You can use the Recently Viewed widget to identify the areas of the application you recently interacted with, including custom Reports, Alerts, Investigations, and Governance. Click the arrow to expand the content and view the details.
Alerts Overview
The Alerts Overview widget allows you to review automated Alerts including the number of open versus closed Alerts for the past day, week, month, or quarter. The widget includes a progress bar for top policies and an interactive chart. The inner layer of the chart displays the total number of Alerts produced by the policy (policies are color-coded). The outer layer shows the distribution of closed versus open Alerts for the selected period of time.
Investigations
You can use the Investigations widget to identify Investigations for the past day, week, month, or quarter that are created from automated Alerts in Imprivata Access Intelligence. Track progress to ensure that Investigations are closed with or without incident in a timely manner.
Alerts by Owner
You can use the Alerts by Owner widget to track automated Alerts by owner for instant visibility into user Alert review progress and identify the number of automated Alerts closed for the past day, week, month, or quarter by a specific owner. Determine how many automated Alerts still need attention by reviewing the Open Alerts count. Click the View link to access the automated Alerts with a status of Not Reviewed.