Monitoring Enterprise Access Management System Performance
You can visually monitor Imprivata Enterprise Access Management system performance on the Appliance Monitor screen of the home page (to get to the Enterprise Access Management SSO home page, click Imprivata Enterprise Access Management on the Imprivata Admin Console home page). You can monitor:
-
Login and unlock activity with the pie charts across the top of the page. These can be hidden or displayed from the Settings.
-
Load and memory usage with bar charts on the left side of the page.
-
Response times with the stock charts on the right side of the page.
-
You can set alerts as described in Adjusting Settings.
The pie charts group login and unlock activities into four user-definable collections, based on the amount of time the Imprivata appliance spends processing the event. The time spans for the four charts are the most recent hour, most recent six hours, most recent 12 hours, and most recent 24 hours.
Note that the login time is only the time the server spends on these messages. It does not count network transit time or time the client spends processing. To set an alert level for the percentage of any login and unlock activity, see Adjusting Settings.
NOTE: When you change the settings, the percentage data is cleared. It is not recalculated.
There is a screen tip for each pie chart, which shows:
-
Timespan covered by the chart
-
Total number of logins in the chart and overall average login time
-
The percentage of logins for each slice
-
The number of logins for each slice
-
Average login time for logins for each slice
To create and run a Login Activity report, in the Imprivata Admin Console, go to Reports > Add new report.
Server load and memory usage values are displayed in four bar charts. Each chart has 24 bars. Each bar represents one hour, going back from the moment you open the monitor or refresh the values from the Refresh link.
The height of a bar represents the value of the measurement in question averaged over that hour.
Example
You bring up the chart at 9:48 am then the right-most bar covers 8:48 am-9:48 am, the bar to the left of that is 7:48 am-8:48 am, and so on.
As you mouse over each bar, a screen tip appears showing:
- The timespan the bar covers.
- The average value of the measurement in that timespan.
You can set an alert level for the bar charts; see Adjusting Settings.
Load and memory usage bar charts provide information on:
- CPU Load
- Imprivata OneSign Load
- Appliance Virtual Memory Usage
- Imprivata OneSign Server Virtual Memory Usage
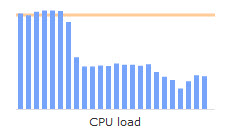
CPU Load
The underlying measurement is the percentage of CPU utilization as reported by the operating system.
This illustration shows an alert (the yellow bar) that was exceeded between 19 hours and 24 hours ago. Super Administrators can receive email notifications when the CPU load exceeds the alert level, and a second email when the load drops below the alert level. Alerts are described in Adjusting Settings.
Imprivata OneSign Load
Imprivata OneSign Load is a unitless measurement of the load on the Imprivata OneSign server due to messages from agents.
Appliance Virtual Memory Usage
This is the amount of virtual memory being used by all processes running on the appliance, not just Imprivata OneSign processes.
Imprivata OneSign Server Virtual Memory Usage
This is the amount of virtual memory being used by the Imprivata server. Contact Imprivata Customer Support if virtual memory usage increases steadily, or if it exceeds 3072 MB.
The Response Times stock charts graph a line superimposed over a bar chart. Each bar represents one hour going back from current time (just like the bar charts). The height of each bar represents the number of times that activity happened in the hour.
Each chart has a line showing datapoints superimposed over the bars. The datapoints are the average of the data in the bar.
As you mouse over each chart, a screen tip appears showing the bar information:
-
The timespan the bar covers.
-
The average value of the measurement in that timespan.
Plus additional response time details:
-
The standard deviation of the measurement in that timespan.
-
The min and max of the measurement in that timespan.
-
The number of times the activity happened in the timespan.
Stock Charts are shown for:
- Directory Connections
- Kerberos Verifications
- Agent Syncs
NOTE: Stock charts are for information only. No alerts can be set on these.
Directory Connections
The bars show the number of the Imprivata server’s connections to the user directories to verify the password the user entered. The datapoints are the average number of milliseconds the connections take.
Kerberos Verifications
This is data on password verification attempts done via Kerberos. The datapoints are the average number of milliseconds the attempts take and the bars are the number of attempts.
If you do not use Kerberos authentication for password authentications, then this chart displays no data.
Agent Syncs
The agent syncs stock chart shows the number of agent syncing events (either automatically or by selecting Sync to Server from the Imprivata agent menu. The datapoints are the average number of milliseconds the pings take, and the bars are the number of pings.
You can set alert levels to improve visual recognition of potential system problems. For example, you can set an alert on total CPU load (shown as a horizontal yellow bar). If the one-hour-averaged value exceeds the alert level or returns to below the alert level, then users with Super administrator privileges are notified via automated email from the Imprivata server.
To set an Appliance Monitor alert:
- Click Settings on the Appliance Monitor screen to open the Appliance Monitor settings page.
- In the page that opens, select the data that should alert the administrator and enter the desired values.
- Click Save to save the alert level settings.